Spatial analysis
Spatial analyses
Urban ventilation corridors, suitability analysis and viewshed analysis, from roughness indices for Warsaw to my Bachelor's thesis.
Spatial analysis is the process of interpreting, exploring and modelling geographic data to extract meaningful insights and patterns. It uses techniques to analyse and visualise spatial data, revealing relationships, trends and correlations between objects, events and places. It provides actionable insights for decision-making in fields such as agriculture, forestry, marine sciences, oil and gas, mining, demography and economics, helping organisations and individuals optimise resource allocation, mitigate risks and improve outcomes.
Ventilation corridors
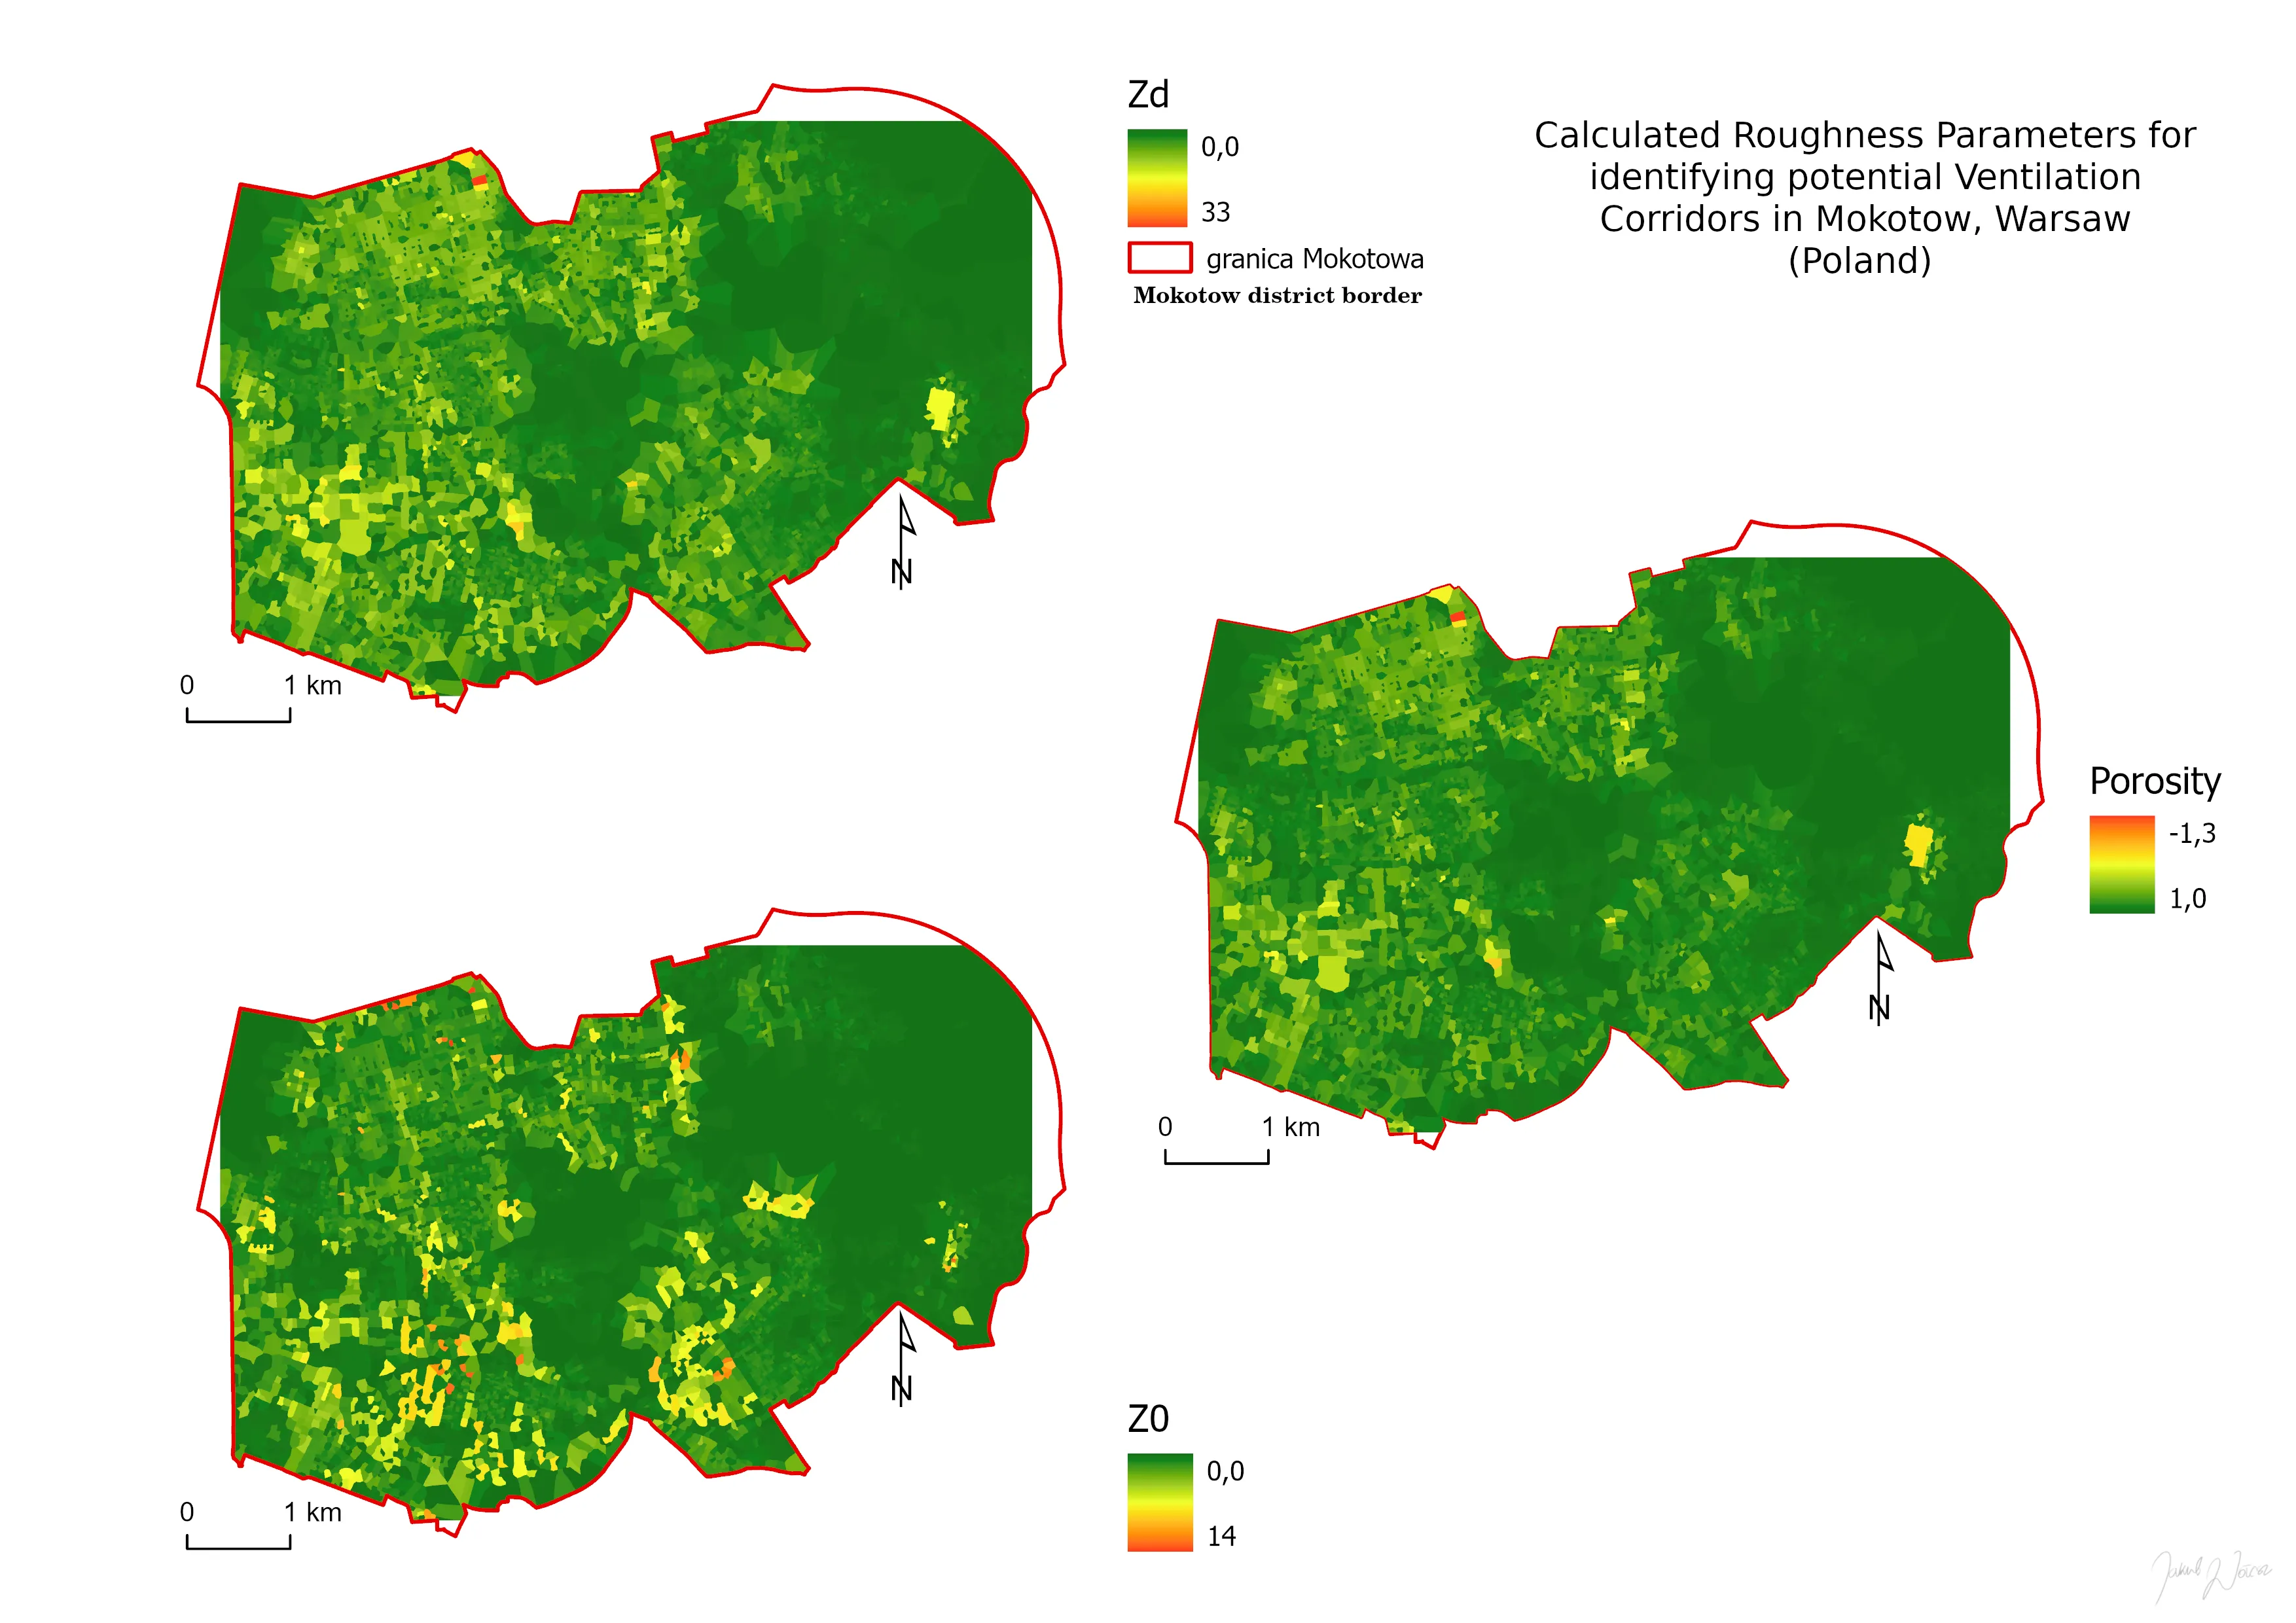
Ventilation corridors are networks of interconnected pathways through which a city is ventilated, improving the urban climate, for example by reducing maximum temperatures. The map shows selected roughness indices that I computed for the Mokotów district of Warsaw, based on the scientific literature on the subject. These parameters are widely used by urbanists and city planners in various publications.
Suitability analysis
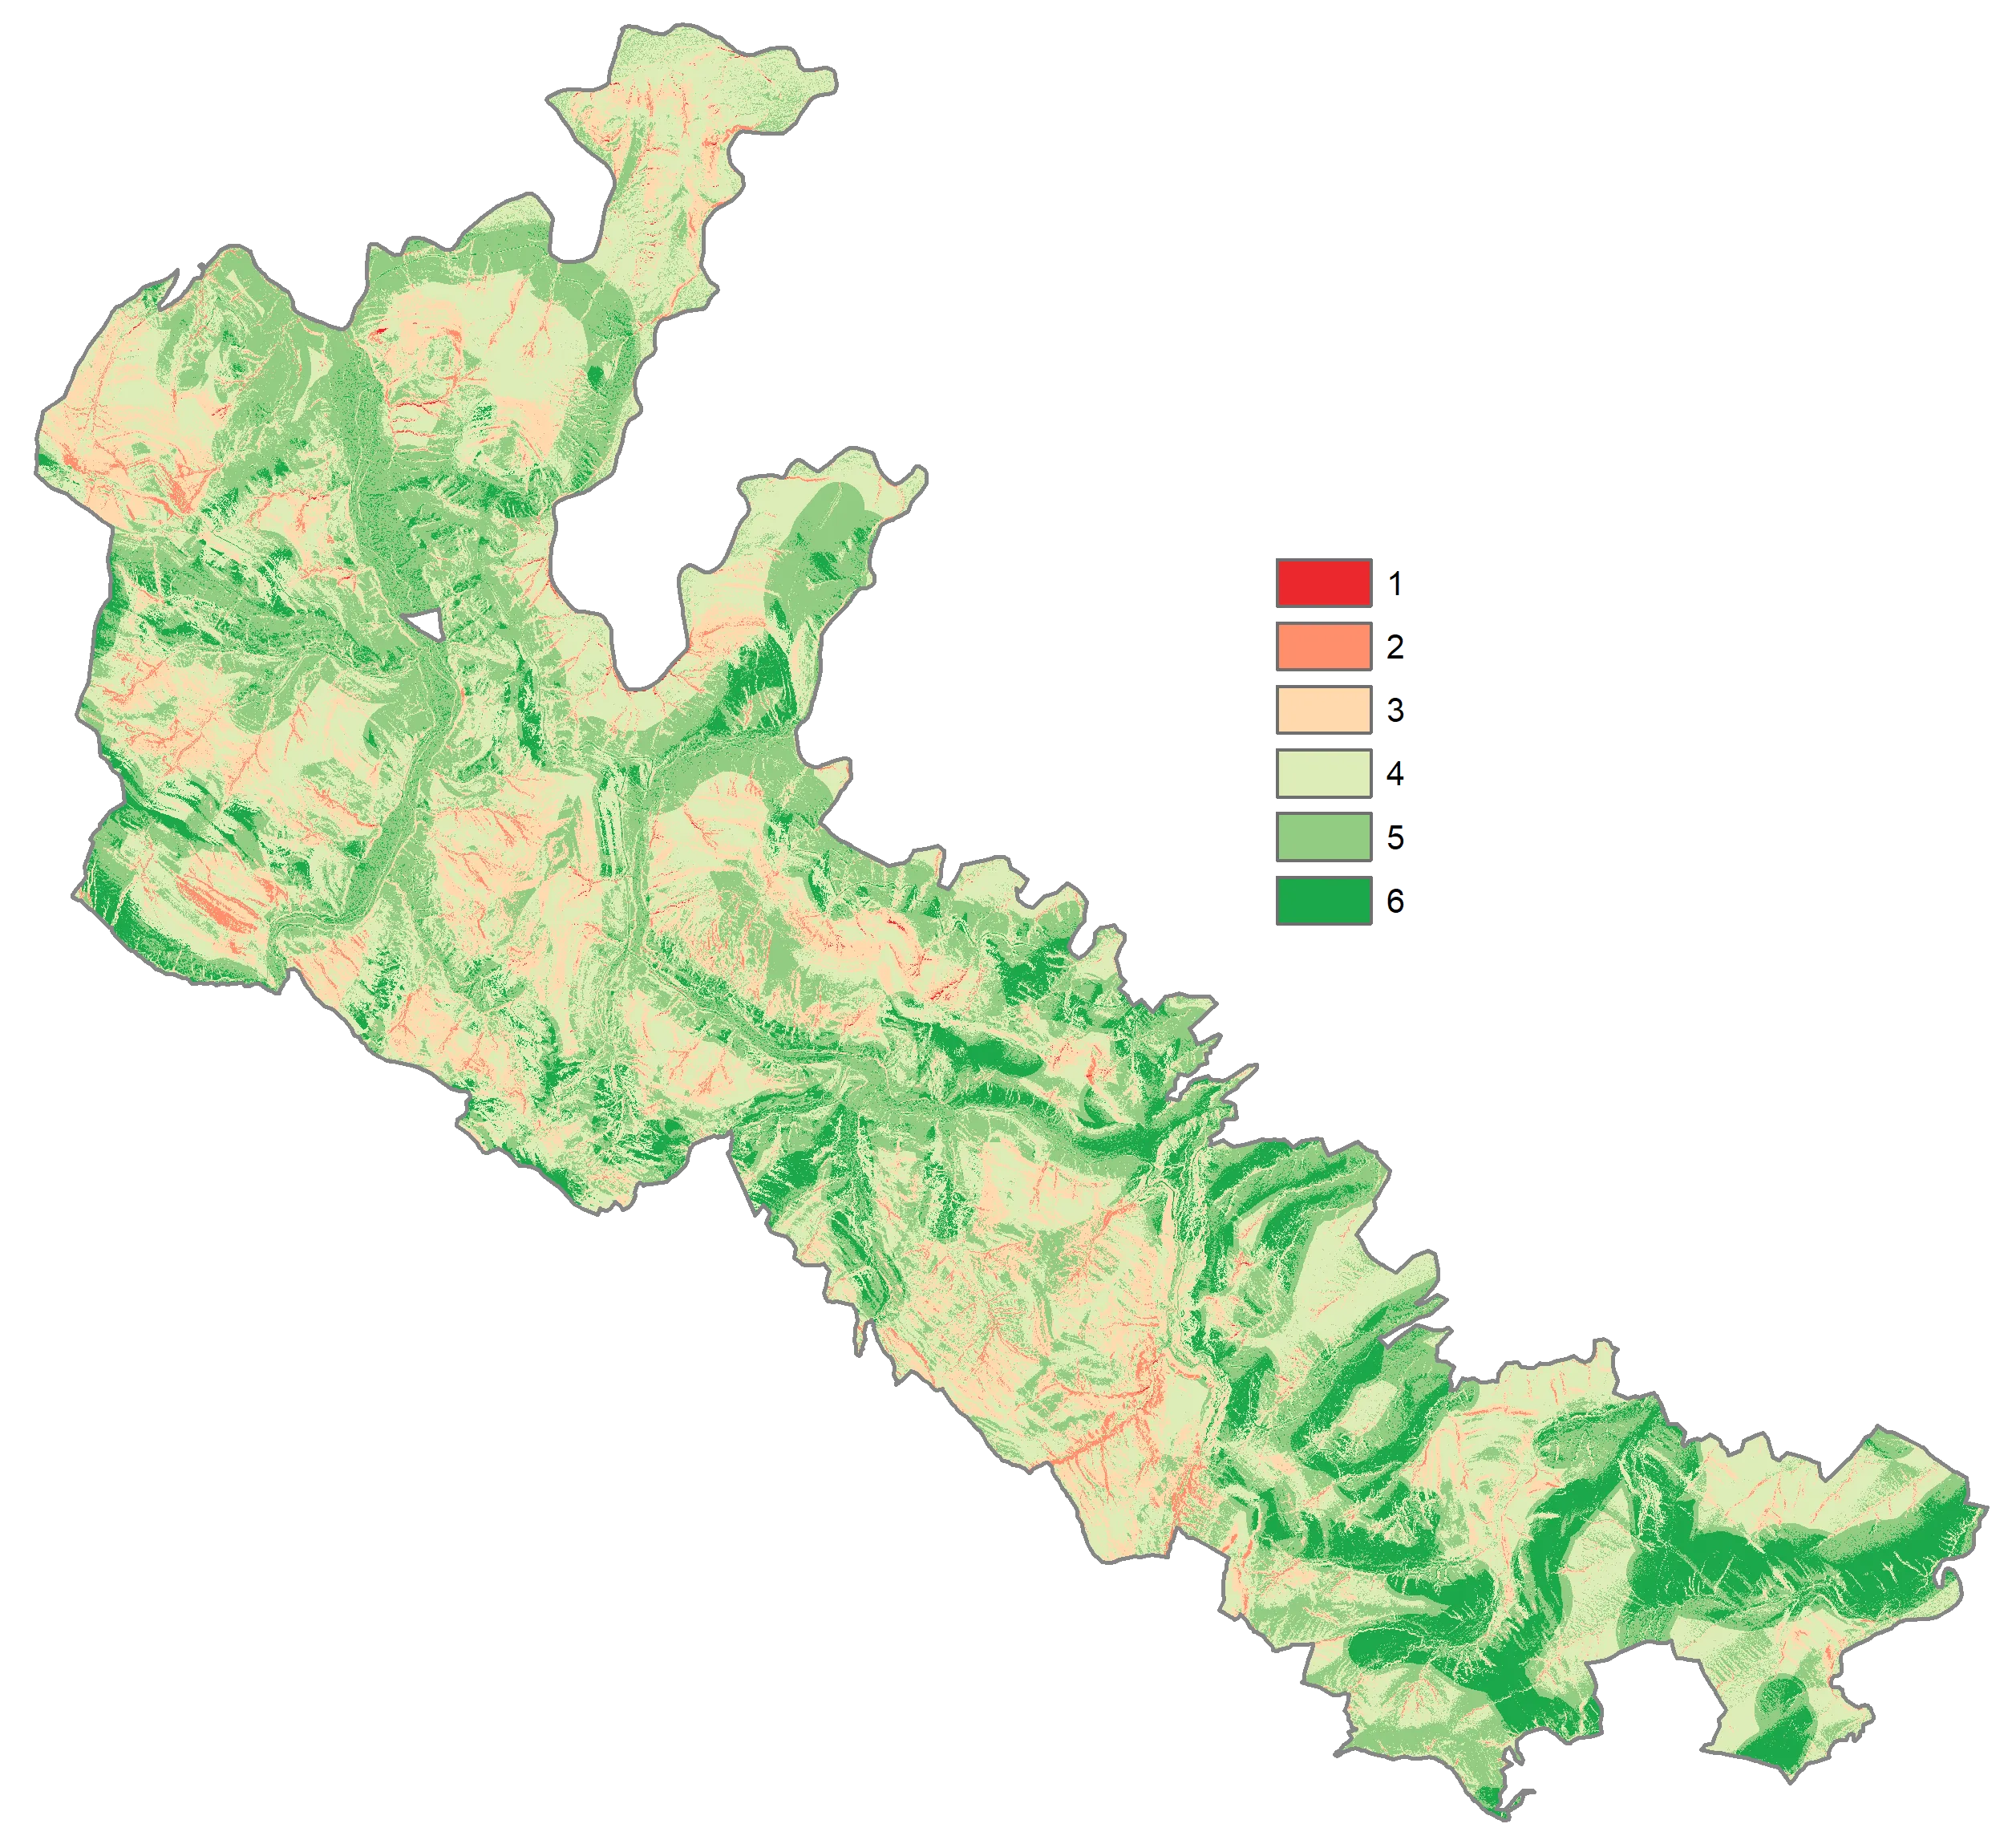
Suitability analysis is a cornerstone of spatial analysis. It identifies the area or areas that best meet specific criteria. Typically run on raster data, it assigns each pixel a class or probability, with higher values indicating greater suitability. The image shows the result of a suitability analysis from my Bachelor’s thesis (more details).
Viewshed analysis
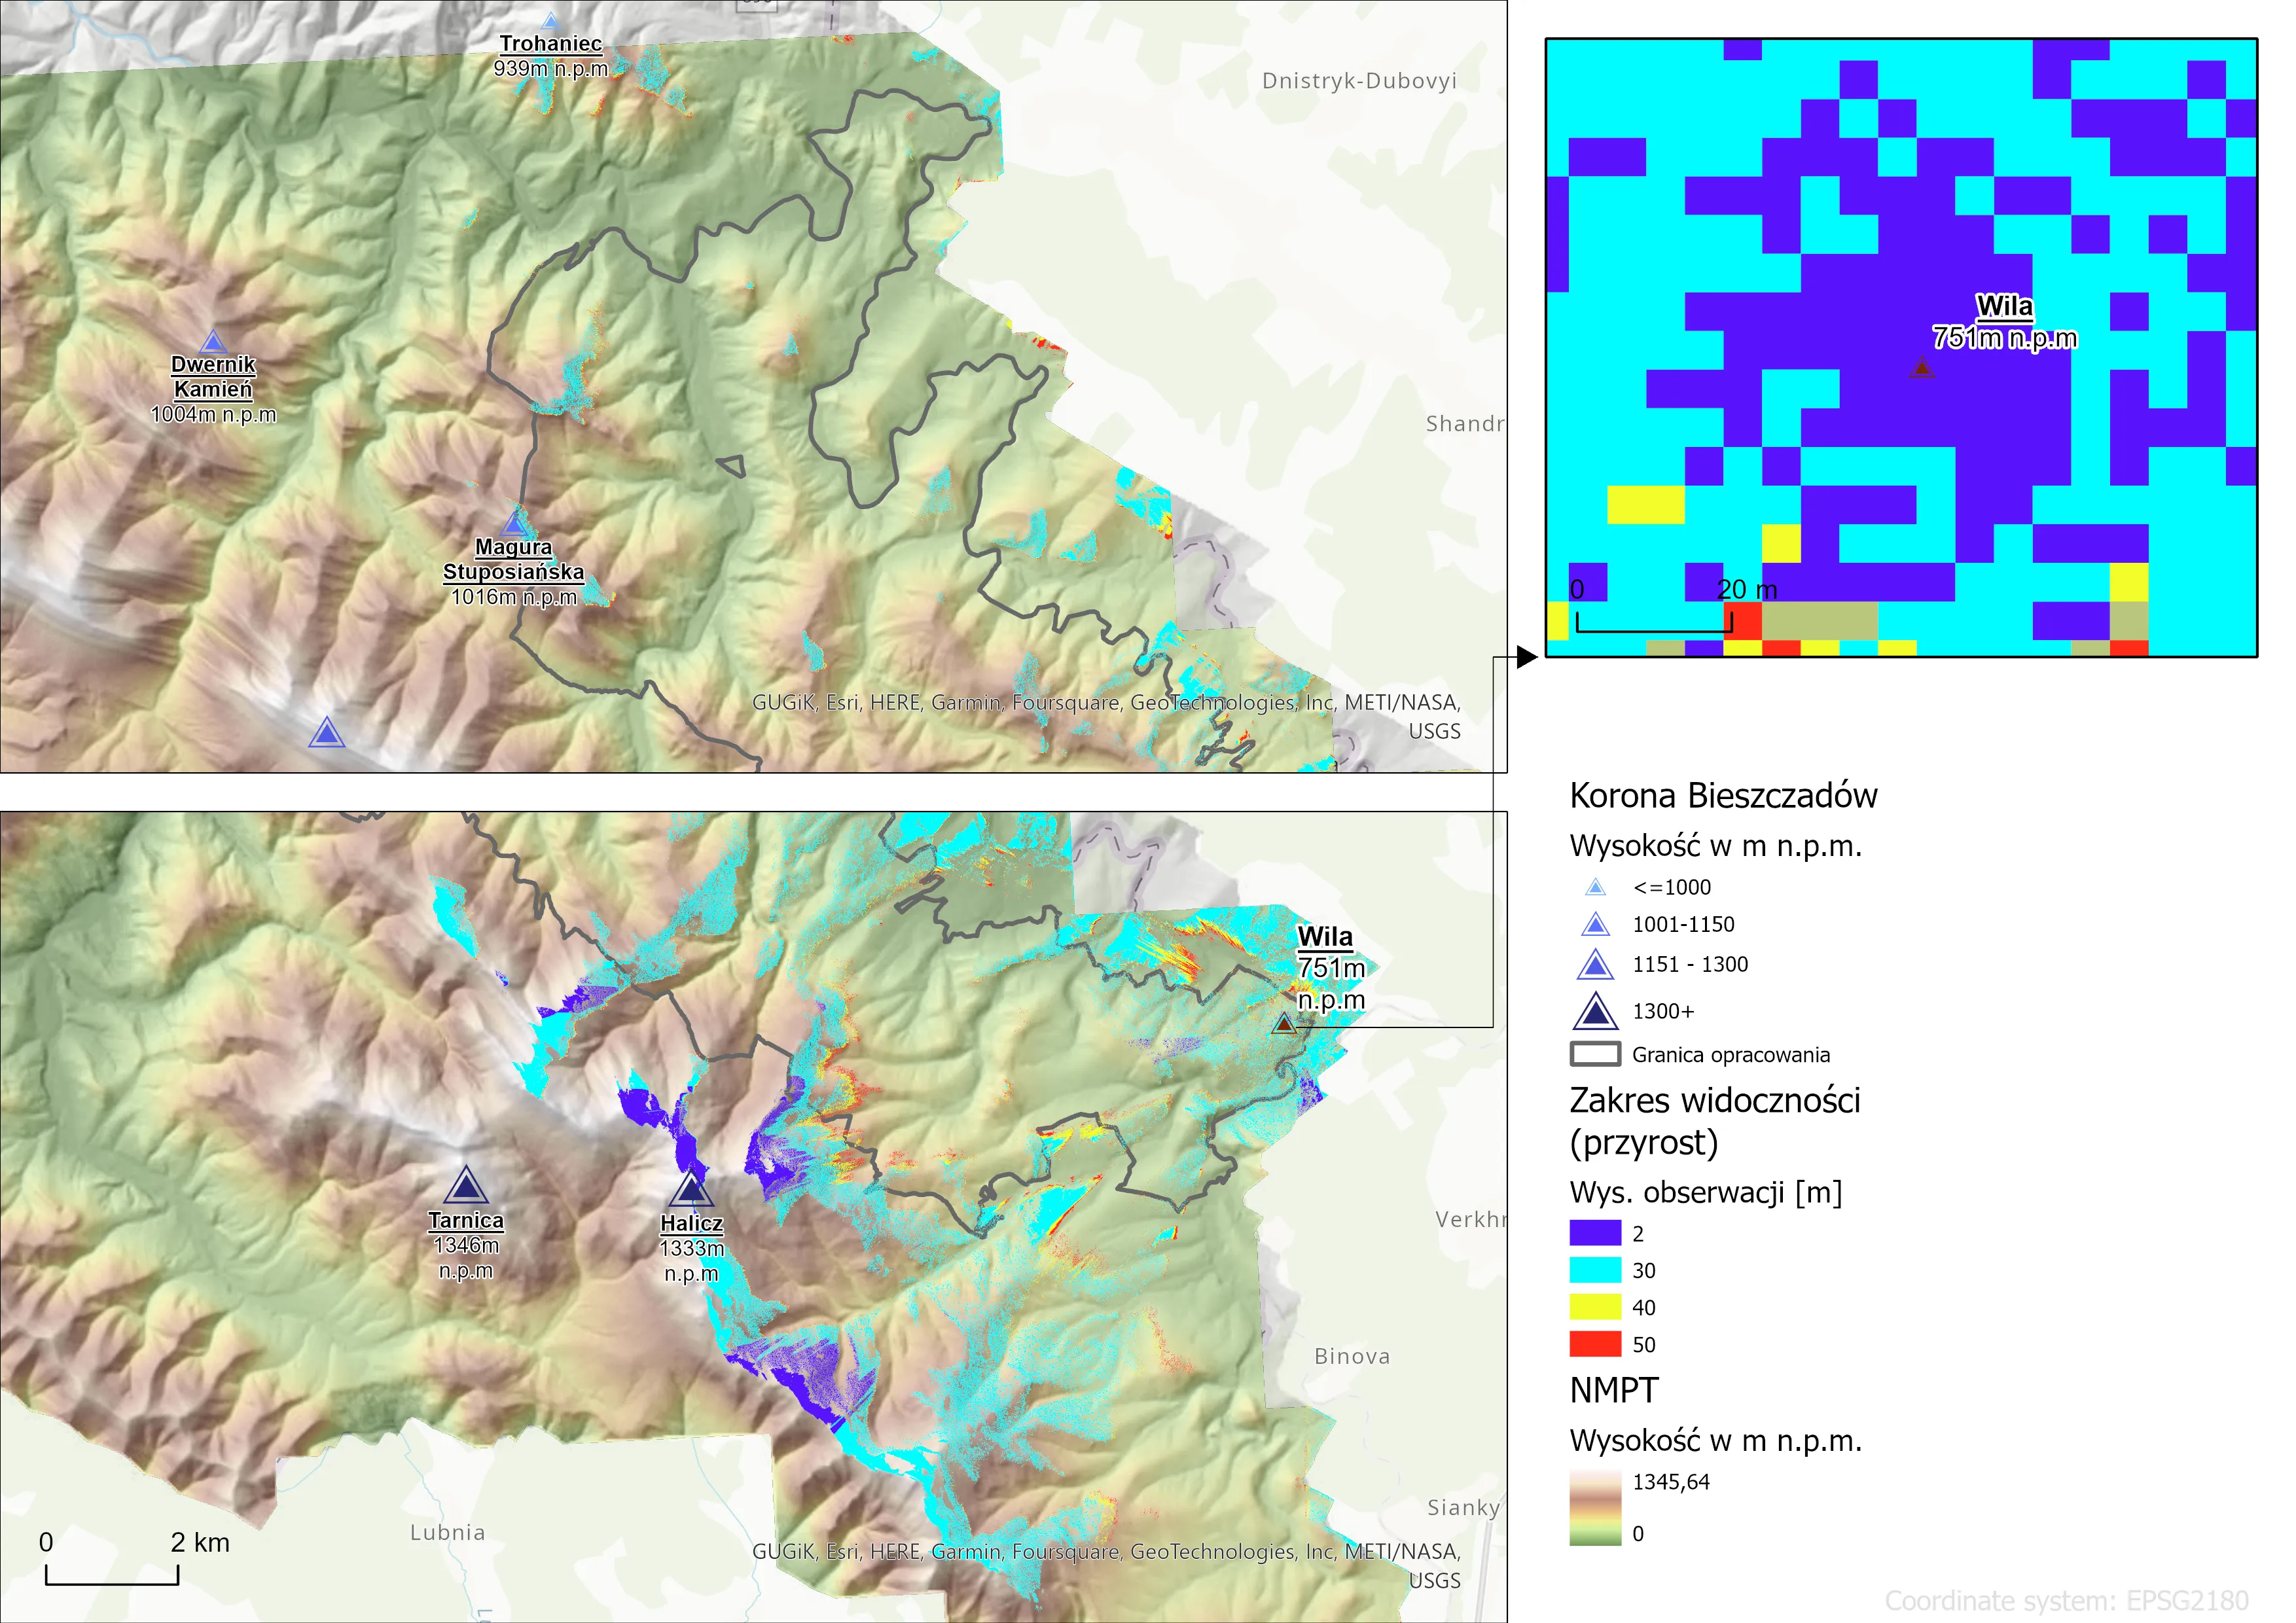
Viewshed analysis uses elevation data to determine what is visible from given objects. It can be used, for example, to assess the visual impact of large new buildings or to find the actual visibility range of radio transmitters or viewpoints. This image is also part of my Bachelor’s thesis.
Gallery
-
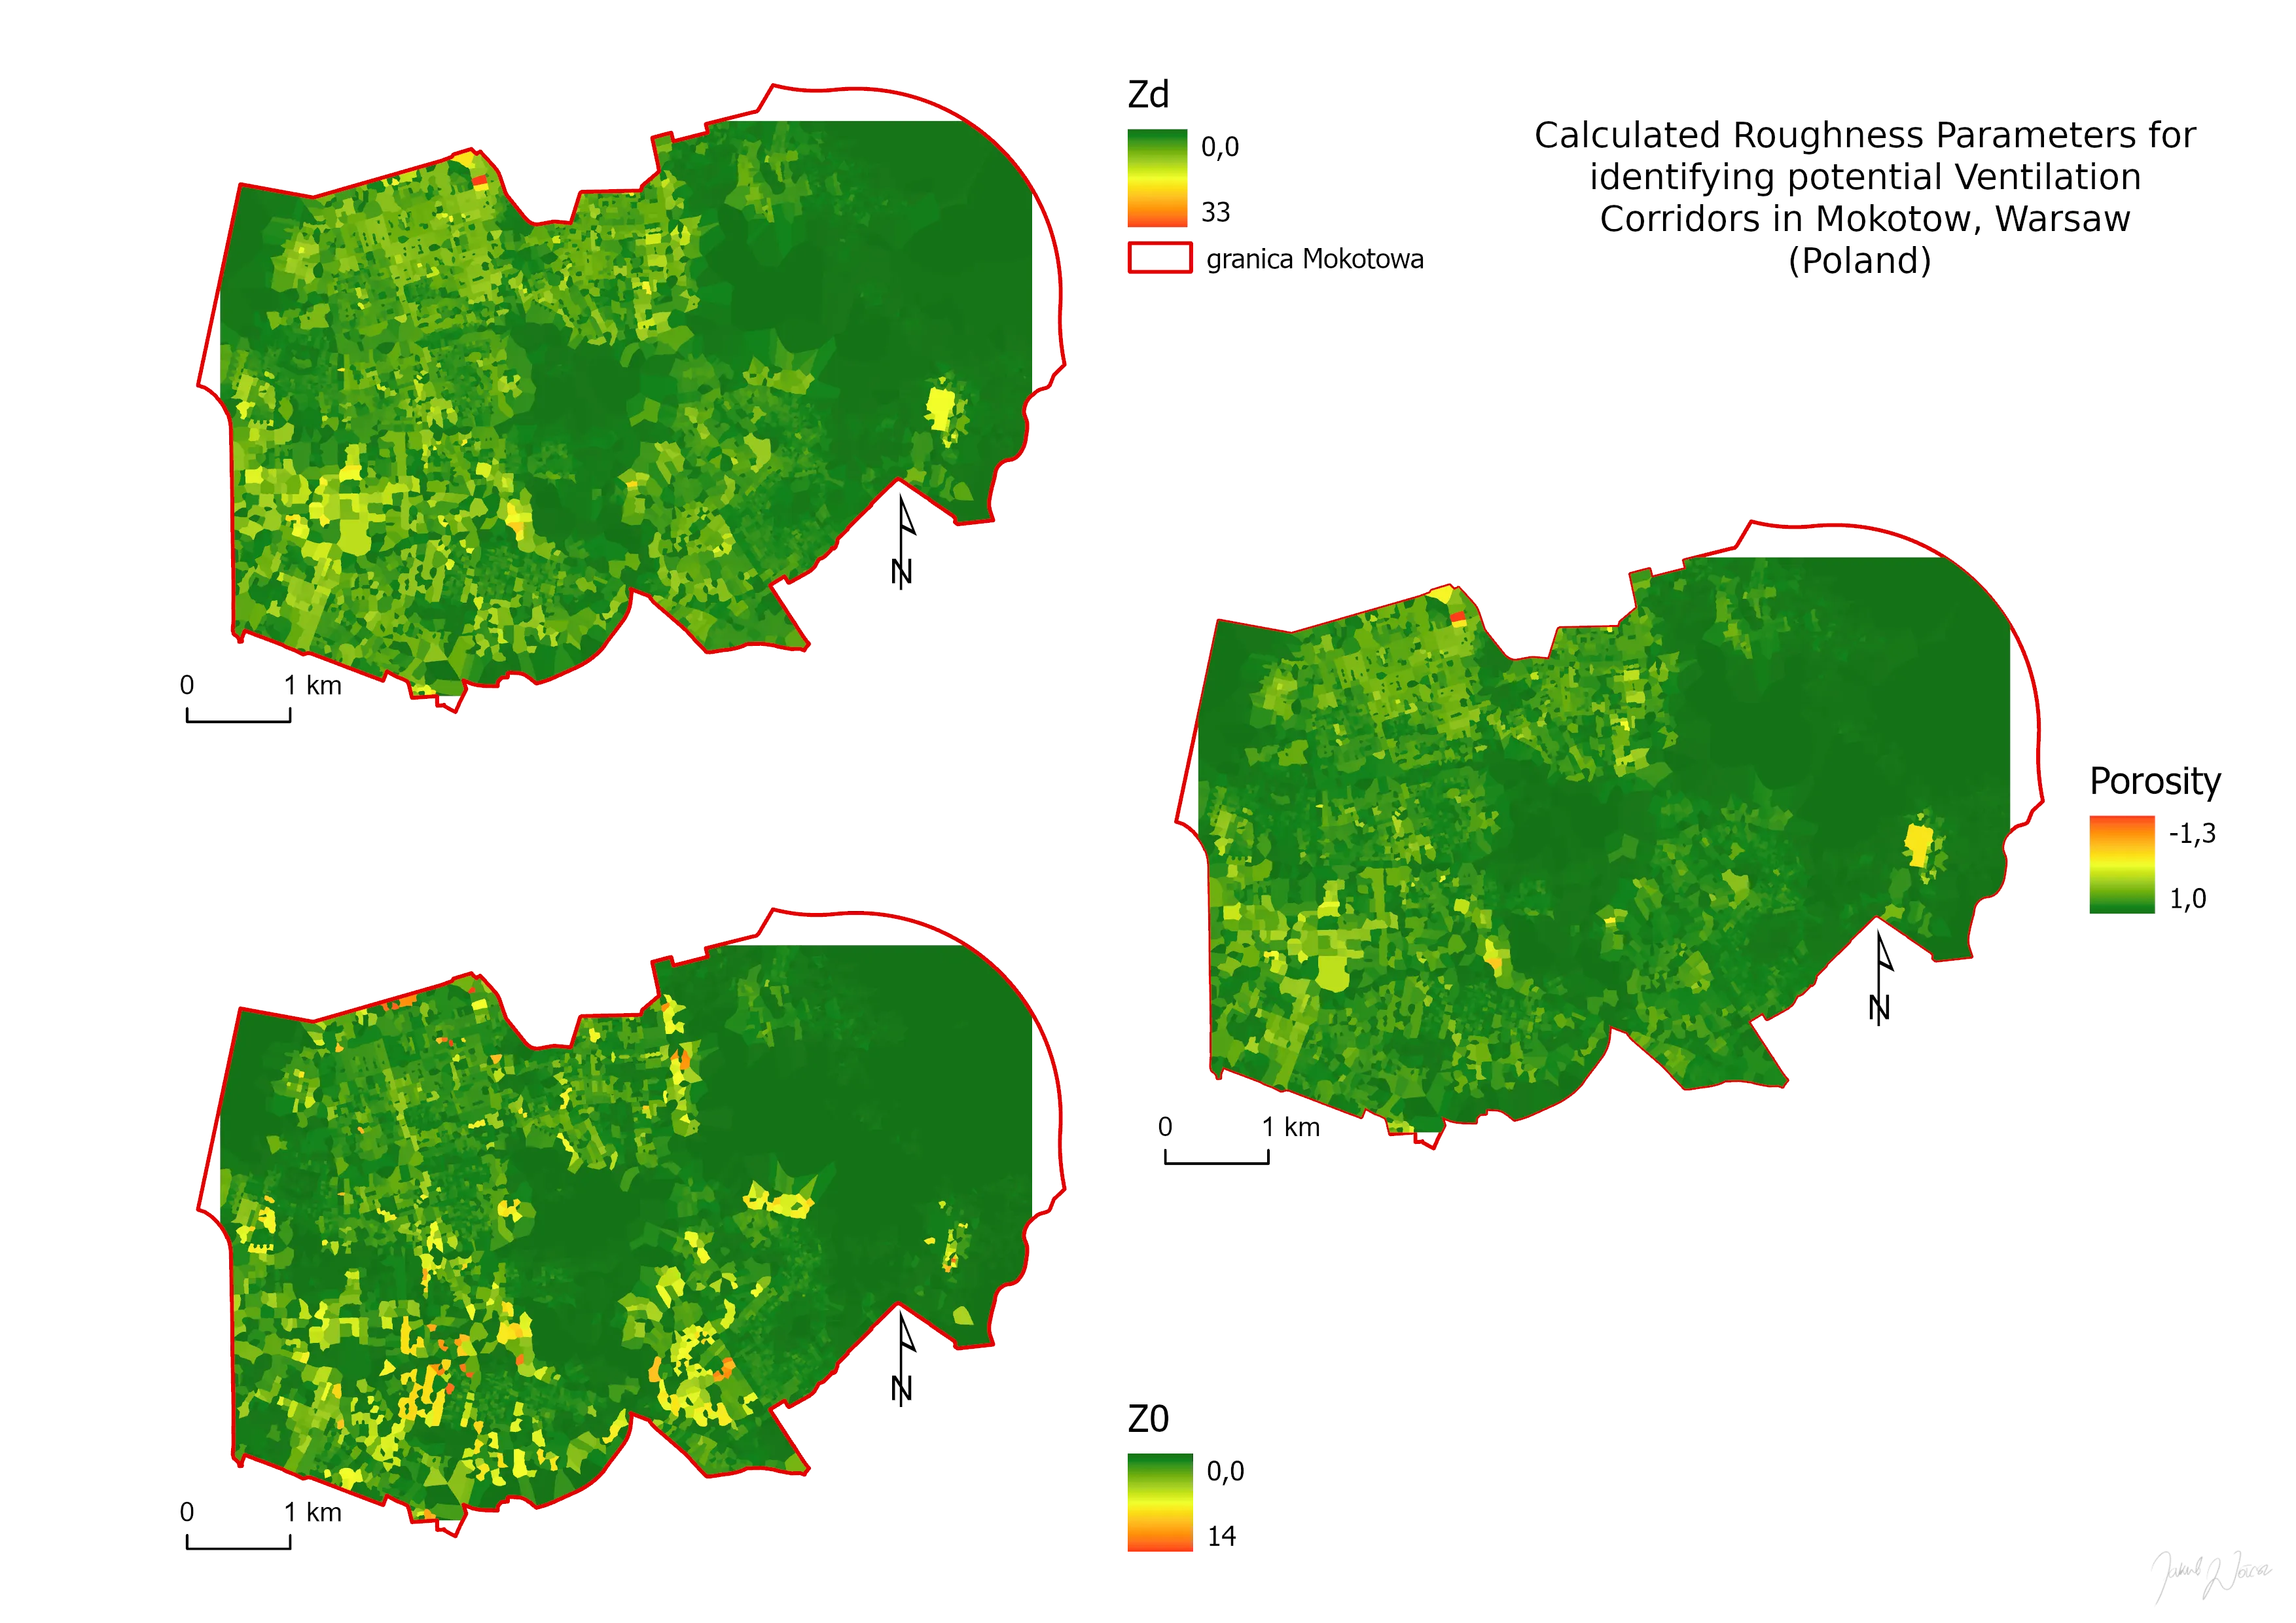
Roughness indices, full map layout