Remote sensing
Satellite data visualisation
Spectral indices and false-colour mosaics from Copernicus Sentinel-2 imagery, used to observe a Canadian forest fire and floods in central Greece.
One of the most powerful uses of satellite imagery is the possibility of calculating spectral indices. Scientific literature mentions tens, even hundreds, of them for various purposes. One such application is predicting, observing and assessing possible or actual damage. These applications can be used, for example, in the forestry sector, which, depending on the scale, covers whole districts, countries, continents and more.
The phenomena shown below were the subject of my summer self-study. I wanted to grasp the force of nature while showing the hidden beauty seen from above.
Forest fire in the Northwest Territories, Canada
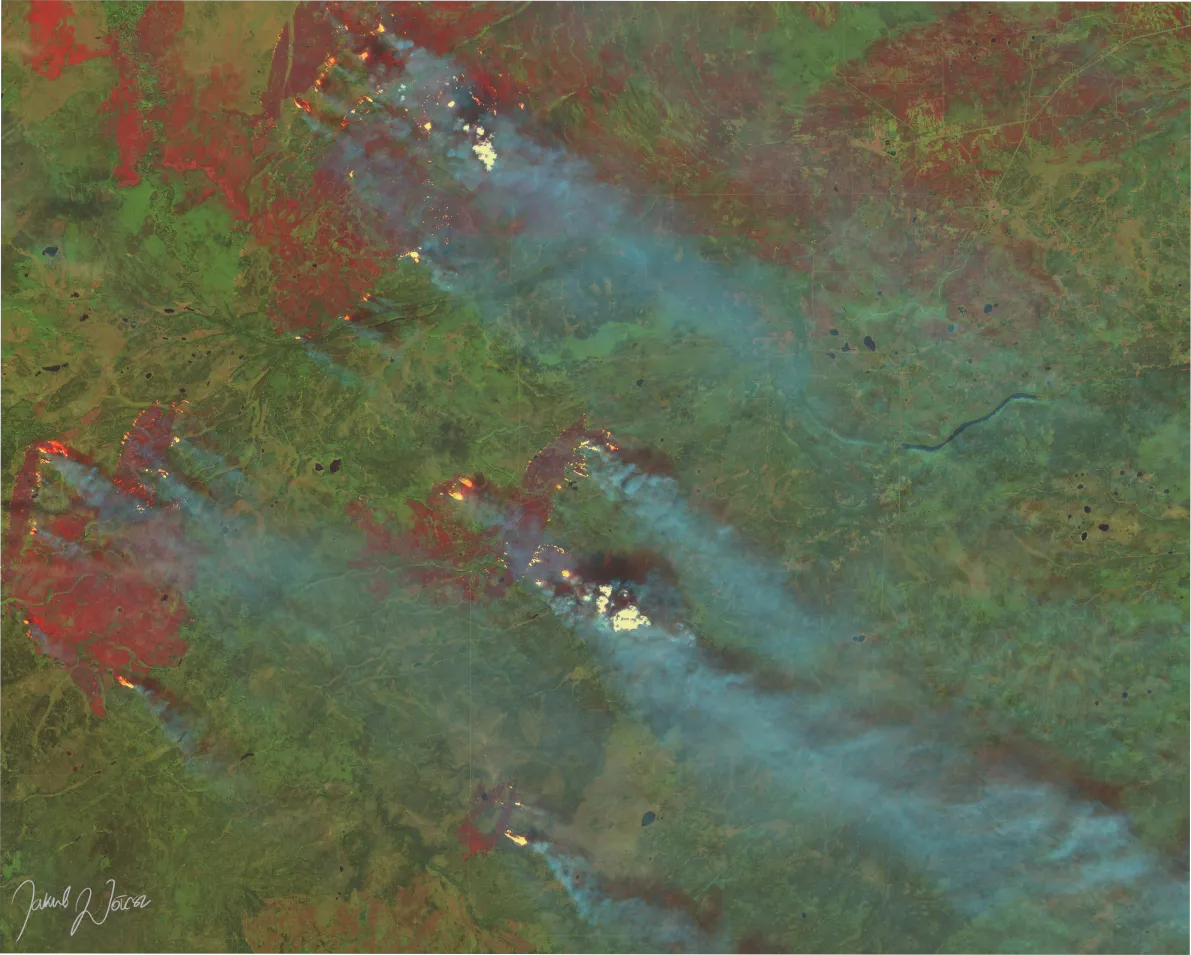
Copernicus Sentinel-2 L2A, 23 August 2023.
The image shows a massive forest fire in the Northwest Territories (Canada). It was generated with a JavaScript custom script that calculates spectral indices and creates an online mosaic in EO Browser.
The mosaic combines three spectral bands/indices (NIR, SWIR and one of the vegetation indices). This combination creates a stark colour contrast that makes it easy to tell burned areas (red) from areas unaffected by fire (green, in the case of vegetation).
Floods near Trikala, Greece
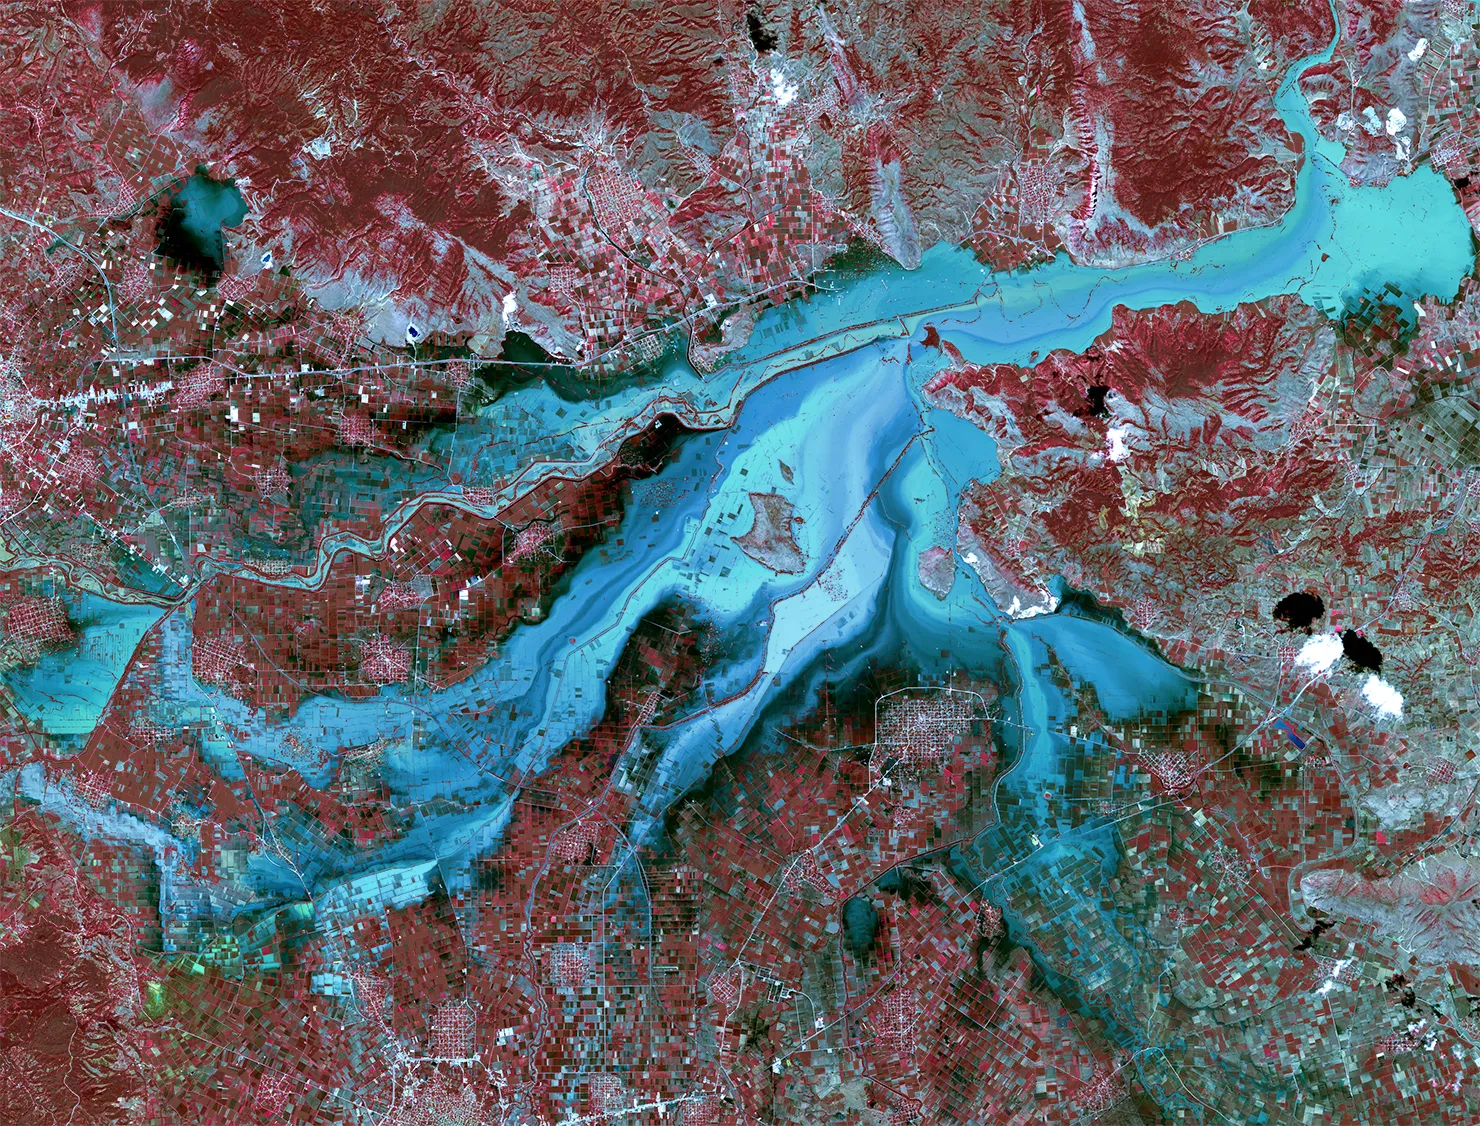
Copernicus Sentinel-2 L2A, 10 September 2023.
A gigantic flooded area caused by heavy rains near the city of Trikala, Greece. The phenomenon is shown on a modified false-colour mosaic in which vegetation appears in shades of red. The flood mainly damaged croplands, visible as reddish rectangles under the blue layer of water.